
THE REAL STORY
BEHIND RECOMP HEALTH.
Ben Morris
Founder · GLP-1 user · Ongoing journey
Recomp Health was not designed from theory. It was built from a personal GLP-1 journey — DEXA scans, blood panels, lean mass tracking, nutritional gaps, and the hard lessons that a scale alone would never have revealed.
Section 1 — Origin
WHY RECOMP HEALTH EXISTS.
When GLP-1 treatment started, the tools available were a bathroom scale, a general calorie tracking app, and quarterly GP check-ins focused on weight and HbA1c. That was standard of care. That was the ceiling.
What was needed — and didn't exist in one place — was a way to track what was actually changing. Not just weight. Lean mass. Fat distribution. Nutritional status. Injection timing patterns. Biomarkers that GLP-1 users are at elevated risk of depleting.
Weight lost on GLP-1 medication can include lean mass as well as fat, and a scale cannot tell the two apart. Measuring it needed a DEXA scan; tracking it day to day needed tools that did not exist in one place.
Recomp Health was built to close that gap — not because the journey was finished, but because the tools were needed while it was still underway.
What scale weight cannot tell you
Section 2 — The journey so far
THE JOURNEY SO FAR.
A documented timeline of GLP-1 treatment, DEXA scans, bloodwork, nutrition adjustments, and training evolution. Upcoming entries are placeholders for future data as the journey continues.
GLP-1 treatment begins
Started GLP-1 medication under GP supervision — first injection 14 November 2025. The baseline DEXA scan (7 November) and blood panel were taken before it.
Baseline DEXA scan
The baseline scan gave a proper starting point rather than a number on a scale: fat mass, lean mass, visceral fat and regional distribution, all measured rather than estimated. Everything that follows on this page is measured against this scan.
First full blood panel — what the scale could not show
A full panel alongside the baseline scan returned four results outside the lab reference range: CRP, insulin, GGT and zinc. None produced obvious symptoms and none were visible on the scale. Vitamin B12 came back at 218 pmol/L — inside the range, but near the bottom of it. That figure matters later.
Protein intake — the gap nobody warned about
GLP-1 appetite suppression made it easy — even pleasant — to eat significantly less. But tracking revealed that protein was falling well below a target of 1.6 g per kg of lean mass. Appetite suppression and adequate protein intake were in direct conflict.
Strength training reprioritised
GLP-1 fatigue and appetite changes made it tempting to reduce training volume. The baseline scan and early lean mass tracking made the stakes of that decision visible. Training was restructured around progressive resistance 3× per week, with key compound lifts logged consistently.
Second DEXA scan — first comparative data
Three months on, the second scan gave the first real comparison. Fat mass had fallen 11.1 kg while lean mass held at just under 96% of baseline — the recomposition pattern rather than undifferentiated weight loss. Visceral fat was down 17%.
Second blood panel — one marker moving the wrong way
The metabolic markers improved: total cholesterol fell from 4.7 to 3.7 mmol/L, LDL from 3.0 to 1.9, HbA1c from 40 to 37. But B12 dropped from 218 to 159 pmol/L, below the reference range, and folate fell as well. Eating substantially less food means taking in substantially fewer micronutrients — a trade-off that only shows up if you test for it.
Third DEXA scan — the pattern holds
Six months in, 22.0 kg of total mass was gone and 17.5 kg of that was fat. Lean mass retention held at 93%. Visceral fat was down nearly a third from baseline. This is the scan the six-month comparison on this page is drawn from.
Third blood panel — the trade-off in full view
The metabolic picture kept improving — GGT back inside range at 48 U/L, HbA1c at 36, triglycerides at 0.7 mmol/L. B12 kept falling, to 113 pmol/L, and folate continued down with it. Both are being re-tested rather than assumed, and the next panel is reported here either way.
The platform is built from the gaps
The tools used throughout this journey — injection tracking, lean mass trends, biomarker logging, nutrition targets — were assembled from separate apps and manual records. Recomp Health was built to put them in one place, designed for this specific context.
Fourth DEXA scan — the record continues
Ten months in. Fat mass kept falling and visceral fat kept reducing, but lean mass came down too: retention now reads 90%, against 93% at the May scan. That is exactly the kind of signal these scans exist to surface — visible in the data rather than inferred from the scale, and published here whether or not it flatters the trend.
Next DEXA scan planned
The journey continues. Regular DEXA scanning remains part of the ongoing monitoring protocol. Results will be published here as part of the continuing data record.
Fourth blood panel — taken 9 October
A fourth blood panel was taken on Friday 9 October 2026, with results due about a week later. They will be published here whichever way they go.
Section 3 — Below the surface
WHAT THE SCALE COULDN'T SHOW.
Vitamin B12
Reduced food volume on GLP-1 medications can make some micronutrients harder to maintain, and B12 is one that comes up often in the literature. In my own case it fell across three panels — 218, then 159, then 113 pmol/L against a 170–800 reference range — with no obvious symptoms at any point. It would not have been identified without testing, and it is still below range today.
Lesson: reduced food volume ≠ adequate micronutrient intake.
Iron, ferritin and folate
Iron stores were the obvious suspect and the testing said otherwise: ferritin sat inside its reference range at every panel (140, 110, 121 µg/L against 20–400), and serum iron stayed at the low end of normal rather than below it. Folate was the marker that actually moved — 15.9 to 9.9 to 7.7 nmol/L, still in range but heading the same way as B12.
Lesson: testing is as useful for ruling a cause out as for finding one.
Protein intake
GLP-1 significantly suppresses appetite. The effect is useful for fat loss but creates a specific risk: it becomes easy to severely under-eat protein without feeling hungry. Tracking revealed consistent protein deficits relative to a protein target set per kg of lean mass. The body doesn't signal the difference.
Lesson: GLP-1 appetite suppression and adequate protein are in direct conflict without active management.
Lean mass trends
DEXA scans made lean mass visible in a way that smart scale BIA alone cannot match. More importantly, tracking lean mass over time — between scans — via weekly BIA provided early signals when the trend shifted. That allowed training and nutrition to be adjusted before DEXA confirmed the problem.
Lesson: trend data is more actionable than single-point measurements.
Recovery and performance
Recovery felt like ordinary GLP-1 fatigue, which is exactly the kind of assumption worth checking rather than accepting. The panels gave something to check it against: B12 below range, iron and ferritin not. Telling GLP-1 adaptation apart from a nutritional cause is not something that can be done by feel, and guessing wrong means changing the wrong thing.
Lesson: fatigue during GLP-1 treatment has several possible causes. Biomarkers help narrow which.
Strength deficits
Compound lift performance declined early in the GLP-1 journey — expected during a caloric deficit. DEXA-validated lean mass data allowed training volume and intensity to be calibrated against what lean mass was actually doing, not just perceived effort. The numbers removed guesswork.
Lesson: strength changes during GLP-1 treatment are more informative when framed against body composition data.
Section 4 — Practical lessons
LESSONS LEARNED.
These are observations from one person's documented GLP-1 journey — not clinical recommendations. They are shared for educational context only. Individual circumstances differ. Always work with your own healthcare team.
Test before you assume.
B12 fell below its reference range with no dramatic symptoms. Without a blood panel at the right time, it would have gone unnoticed for months. Iron was the obvious suspect, and testing said otherwise: ferritin stayed within its reference range at every panel. Assumptions about nutritional status during a GLP-1 deficit are not reliable.
Protein requires active management, not passive intent.
Knowing that protein intake matters is not enough. GLP-1 appetite suppression makes under-eating protein the path of least resistance. Consistent tracking against a specific lean mass-adjusted target was required — not general awareness.
Lean mass data changes what you do.
Weekly BIA trend data and quarterly DEXA confirmation produced decisions that scale weight alone would not have triggered. Training adjustments and nutrition changes were both calibrated against actual body composition data, not guesswork.
Resistance training is not optional in a GLP-1 deficit.
Structuring progressive overload consistently around GLP-1 energy and appetite patterns was the variable most worth protecting. Even so, lean mass fell to 90% of baseline by September 2026.
Course corrections compound.
Each discovery — the protein gap, the training adjustment, the lipid and HbA1c response — produced a small improvement. No single change was transformative. The accumulation of small, data-informed corrections over ten months produced the outcome. Not everything is corrected: B12 is still below range and still being worked on. Tracking is what makes both the wins and the open problems visible.
The journey does not end at a target weight.
Reaching a body composition target is a milestone, not a finish line. Ongoing DEXA monitoring, regular bloodwork, and continued strength training remain the protocol. The tools that worked during the transformation are the same tools needed to maintain and build on it.
All lessons on this page are based on personal experience and general educational information. They are not medical advice, clinical recommendations, or a guide to any specific treatment protocol. Every person's situation is different. Consult your prescribing clinician, registered dietitian, and other qualified healthcare professionals before making any changes to your health management.
Section 5 — What comes next
THE JOURNEY CONTINUES.
Future DEXA scans
Regular DEXA scanning continues as part of the ongoing monitoring protocol. Scan results will be published to this page as the data record grows — with full transparency about what they show.
Ongoing bloodwork
B12, iron, ferritin, HbA1c, lipids, testosterone, and vitamin D will continue to be tested regularly. The biomarker monitoring cadence that identified early deficiencies remains part of the protocol.
Strength and body composition
Progressive resistance training continues. Key lift tracking and lean mass monitoring via smart scale BIA continue to be the weekly feedback mechanism. The goal has shifted from active fat loss to maintenance and strength development.
What will be published on this page as the journey continues
This page will be updated as data becomes available. All content is personal, educational, and informational only.
Visual proof
BODY SCAN COMPARISON.
Four colour-coded whole-body DEXA scans, same subject, Nov 2025 to Sep 2026 — red = fat, green = lean, white = bone. Images carry no name or date of birth.
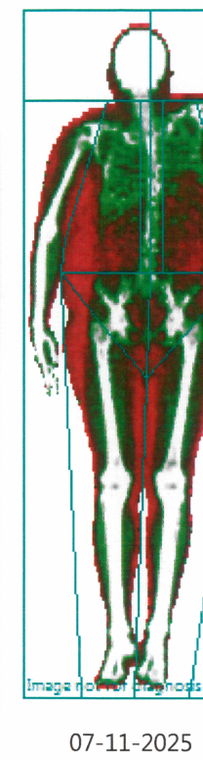
Nov 2025
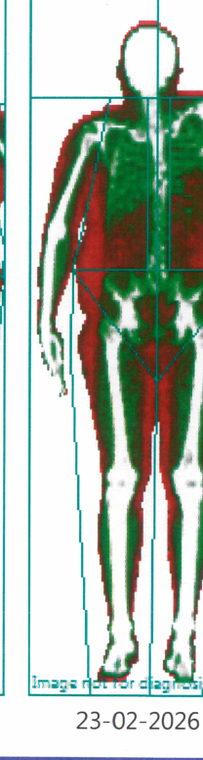
Feb 2026
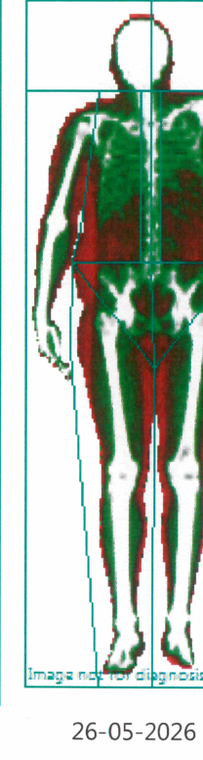
May 2026
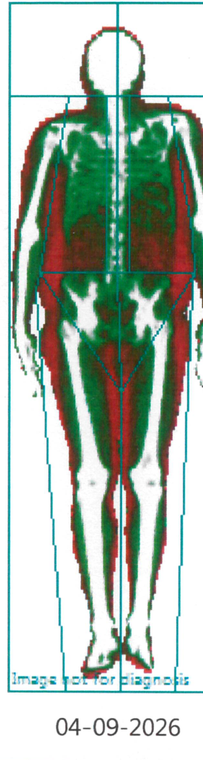
Sep 2026
The colour shift from red toward green across the four scans reflects fat mass falling faster than lean mass — lean mass also fell, from 63.8 to 57.3 kg.
This data is personal and educational in nature. It is not a recommendation for any specific approach. Individual outcomes vary. Consult your own healthcare professionals for personalised guidance.
Data record
DEXA, BLOODWORK & PROGRESS DATA.
Published as data becomes available. All entries are personal and educational — not clinical documentation.
Vitamin B12 (pmol/L)
Folate (nmol/L)
B12 & Folate Trend
B12 fell below the lab reference range across three panels; folate moved the same way while staying in range. Both are re-tested in the next panel.
HbA1c (mmol/mol)
Metabolic Markers
HbA1c across three panels. GGT back inside its range (66 to 48 U/L); insulin still above its range (14.2 to 18.7 mIU/L).
Lean mass (kg)
Lean Mass (DEXA)
DEXA lean mass across four scans: 90% of the starting value retained while fat mass fell 21.4 kg.
Visceral fat (kg)
Visceral Fat
CoreScan visceral fat mass across four DEXA scans: 2.25 to 1.32 kg, down 41%.
All data shared is personal and educational in nature. It is not a recommendation for any specific approach. Individual outcomes vary. Consult your own healthcare professionals for personalised guidance.
Educational Use Only
Recomp Health provides educational and informational content only. The platform does not provide medical advice, diagnosis, or treatment. Always consult a qualified healthcare professional regarding medications, treatment decisions, and health concerns.